今天重新开始学习机器学习,训练了一个简单的分类器。
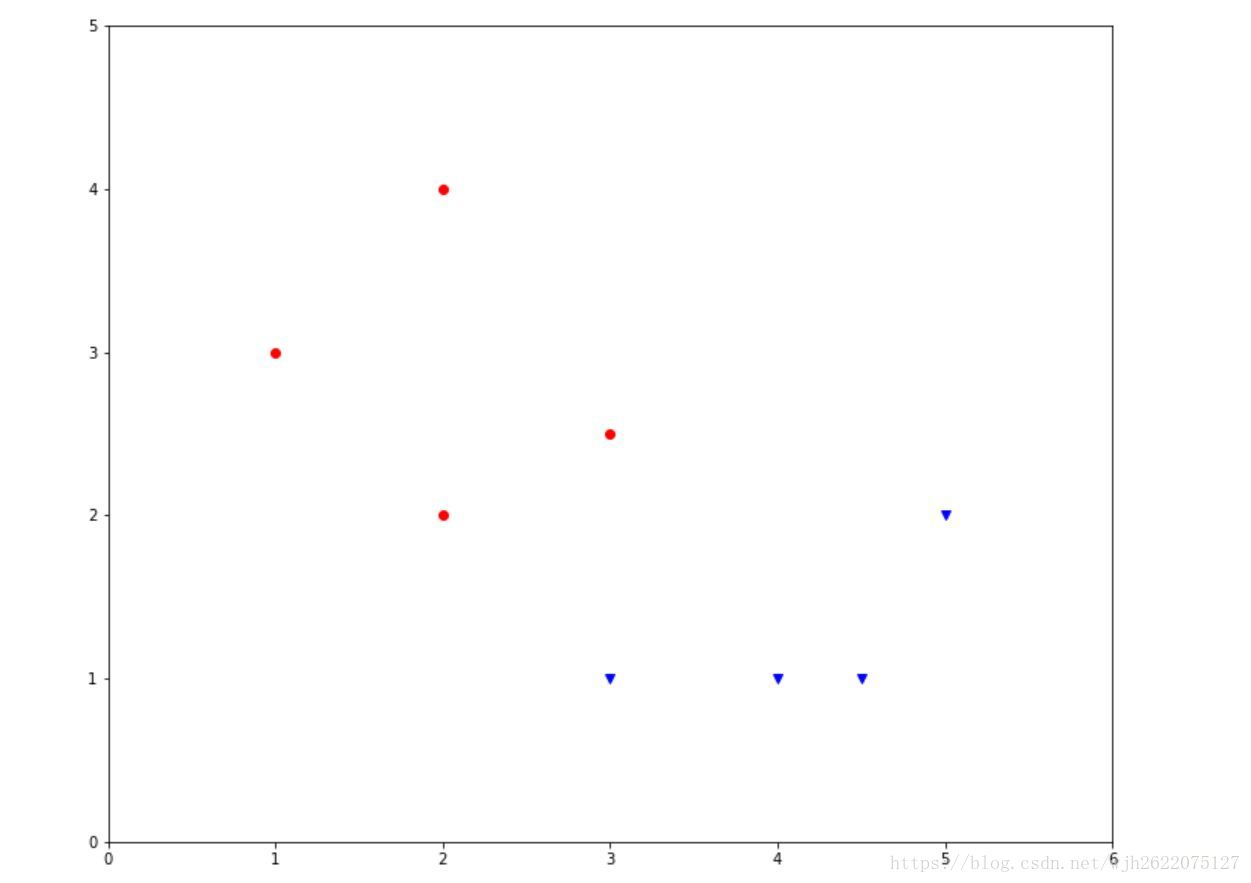
如何工作的呢?给定一组训练数据,他们的参数有三个,x轴坐标,y轴坐标,类别。即(x, y, c)。如图所示
 红色的圆点代表第一类点,类别编号为1;蓝色的倒三角形代表第二类点,类别编号为0.
我们的目的,是根据这些训练数据,拟合出一条边界线,来将两种类别的数据划分开来,这个系统就叫做分类器。鉴于笔者水平尚浅,故暂时只能训练从原点出发的线性分类器。
下面就讨论这个简单分类器的具体实现,对于入门者来说,其实也可以学到不少东西。
第一步,导入我们需要的python库
在这份代码中,我用到了numpy库和matplotlib库,并且在jupyter notebook中实现了内置matplotlib。
1
2
3
|
%matplotlib inline
import matplotlib.pyplot as plt
import numpy as np
|
第二步,获取训练数据并解析坐标
我们的输入格式是这样的:
1.0 3.0 1,
3.0 1.0 0,
2.0 2.0 1,
4.0 1.0 0,
2.0 4.0 1,
4.5 1.0 0,
3.0 2.5 1,
5.0 2.0 0
每行代表一个坐标的信息,分别是横坐标,纵坐标,类别。每组数据间用, 分隔,因此可以很简单的用split函数将数据划分。具体到每个坐标的信息,我们可以利用numpy的fromstring函数获取一个字符串信息,并把他们转化为float类型。
 1
 2
 3
 4
 5
 6
 7
 8
 9
10
11
12
13
14
15
16
|
get = input("请输入训练数据,第三个参数为类别")
get = get.split(',')
train_data = []
x1 = []
y1 = []
x0 = []
y0 = []
for each in get:
    train_data.append(np.fromstring(each, dtype=float, sep=' '))
for each in train_data:
    if each[2] == 1:
        x1.append(each[0])
        y1.append(each[1])
    else:
        x0.append(each[0])
        y0.append(each[1])
|
第三步,随机化数据
为了使我们的数据更加准确,我们需要用到随机化数据。如果不随机化会怎么样呢?不随机化,我们的分类器就可能陷入某种极端情况,从而得出错误的解。
代码中,我们使用numpy的随机技术。
1、首先初始化随机种子,由于我希望每次都随机,所以我给随机种子传递的参数也是随机的
2、随机化排列,这样可以得到一个随机的排列,以在后续处理数据时相对公平。
1
2
3
|
np.random.seed(np.random.randint(0, 10000, size=1, dtype=int))
order1 = np.random.permutation(len(x1))
order0 = np.random.permutation(len(x0))
|
第四步、生成分界线斜率
这一步是最核心的一步,我们通过输入的训练数据对直线斜率进行调整。方法就是利用预测值与期望值之间的误差进行拟合,同时使用学习率learn和一些调整量adjust,使得过去和现在的训练能同时起到作用,而不偏颇。
1
2
3
4
5
6
7
|
slope = 1.0
adjust = 0.0
learn = 0.5
for i in range(len(x1)):
    slope += (y1[order1[i]] - slope*x1[order1[i]] + adjust)/x1[order1[i]]*learn
    slope += (y0[order0[i]] - slope*x0[order0[i]] - adjust)/x0[order0[i]]*learn
print(slope)
|
第五步、处理测试数据
对测试数据的读入,我们的处理和训练数据是一样的。
通过对预边界测试和实际值的对比,我们得出测试数据的类别信息,从而实现分类。
 1
 2
 3
 4
 5
 6
 7
 8
 9
10
11
12
13
14
15
|
get = input("请输入测试数据:")
get = get.split(',')
test_data = []
x2 = []
y2 = []
for i in get:
    test_data.append(np.fromstring(i, dtype=float, sep=' '))
for i in test_data:
    x2.append(i[0])
    y2.append(i[1])
for i in range(len(x2)):
    if x2[i]*slope > y2[i]:
        print(0)
    else:
        print(1)
|
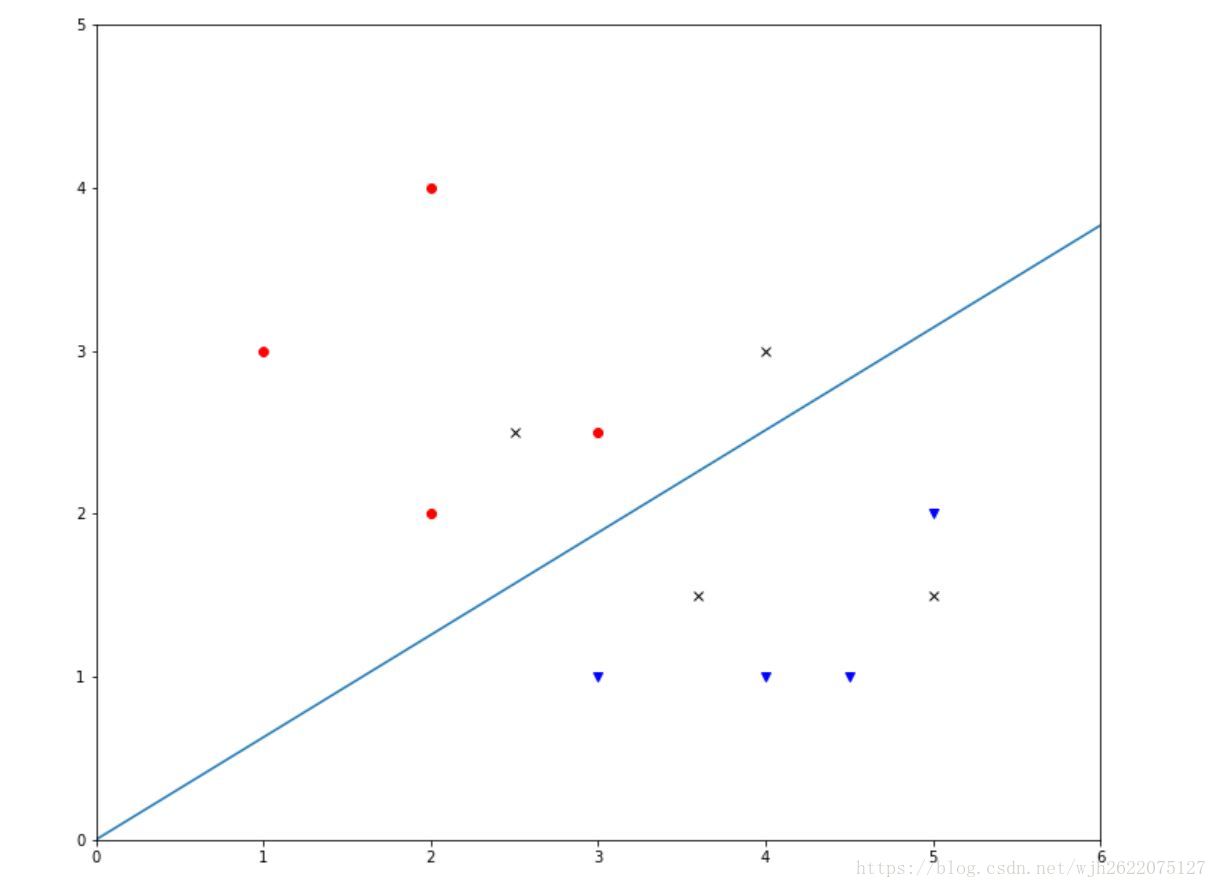
第六步、输出展示分类结果
图像是最直观的,因此我们利用matplotlib来展示结果。
 1
 2
 3
 4
 5
 6
 7
 8
 9
10
11
|
x = np.array(range(7))
y = []
for i in x:
    y.append(slope*i)
plt.figure(figsize=(12, 10))
plt.xlim(0, 6)
plt.ylim(0, 5)
plt.plot(x, y, linestyle='-')
plt.plot(x1, y1, 'o', color='red')
plt.plot(x0, y0, 'v', color='blue')
plt.plot(x2, y2, 'x', color='black')
|
如图
 可见,我们的分类器准确度还是比较高的。
输入数据
 1
 2
 3
 4
 5
 6
 7
 8
 9
10
11
12
13
14
15
|
# 训练集
1.0 3.0 1,
3.0 1.0 0,
2.0 2.0 1,
4.0 1.0 0,
2.0 4.0 1,
4.5 1.0 0,
3.0 2.5 1,
5.0 2.0 0

# 测试集
4.0 3.0,
2.5 2.5,
3.6 1.5,
5.0 1.5
|
完整代码
 1
 2
 3
 4
 5
 6
 7
 8
 9
10
11
12
13
14
15
16
17
18
19
20
21
22
23
24
25
26
27
28
29
30
31
32
33
34
35
36
37
38
39
40
41
42
43
44
45
46
47
48
49
50
51
52
53
54
55
56
57
58
59
60
|
%matplotlib inline
import matplotlib.pyplot as plt
import numpy as np

get = input("请输入训练数据,第三个参数为类别")
get = get.split(',')
train_data = []
x1 = []
y1 = []
x0 = []
y0 = []
for each in get:
    train_data.append(np.fromstring(each, dtype=float, sep=' '))
for each in train_data:
    if each[2] == 1:
        x1.append(each[0])
        y1.append(each[1])
    else:
        x0.append(each[0])
        y0.append(each[1])

np.random.seed(np.random.randint(0, 10000, size=1, dtype=int))
order1 = np.random.permutation(len(x1))
order0 = np.random.permutation(len(x0))

slope = 1.0
adjust = 0.0
learn = 0.5
for i in range(len(x1)):
    slope += (y1[order1[i]] - slope*x1[order1[i]] + adjust)/x1[order1[i]]*learn
    slope += (y0[order0[i]] - slope*x0[order0[i]] - adjust)/x0[order0[i]]*learn
print(slope)

get = input("请输入测试数据:")
get = get.split(',')
test_data = []
x2 = []
y2 = []
for i in get:
    test_data.append(np.fromstring(i, dtype=float, sep=' '))
for i in test_data:
    x2.append(i[0])
    y2.append(i[1])
for i in range(len(x2)):
    if x2[i]*slope > y2[i]:
        print(0)
    else:
        print(1)

x = np.array(range(7))
y = []
for i in x:
    y.append(slope*i)
plt.figure(figsize=(12, 10))
plt.xlim(0, 6)
plt.ylim(0, 5)
plt.plot(x, y, linestyle='-')
plt.plot(x1, y1, 'o', color='red')
plt.plot(x0, y0, 'v', color='blue')
plt.plot(x2, y2, 'x', color='black')
|
 红色的圆点代表第一类点,类别编号为1;蓝色的倒三角形代表第二类点,类别编号为0.
 可见,我们的分类器准确度还是比较高的。